What's working and what isn't.
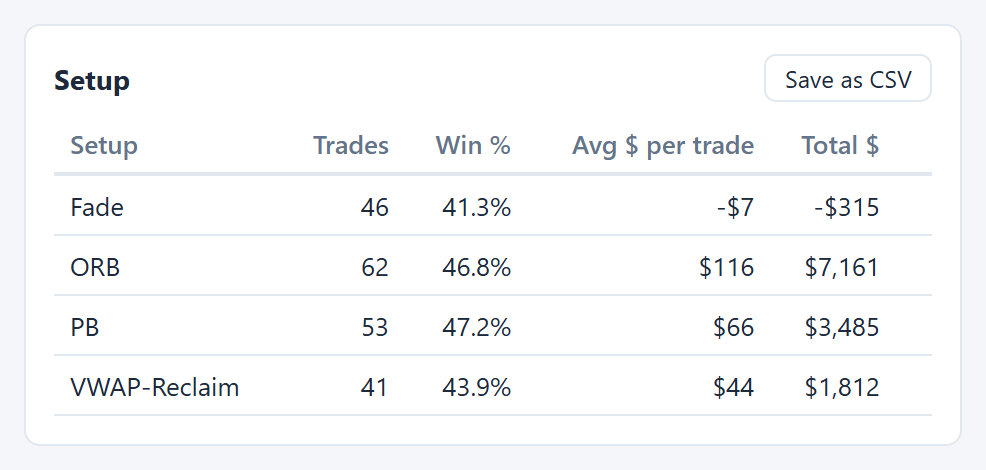
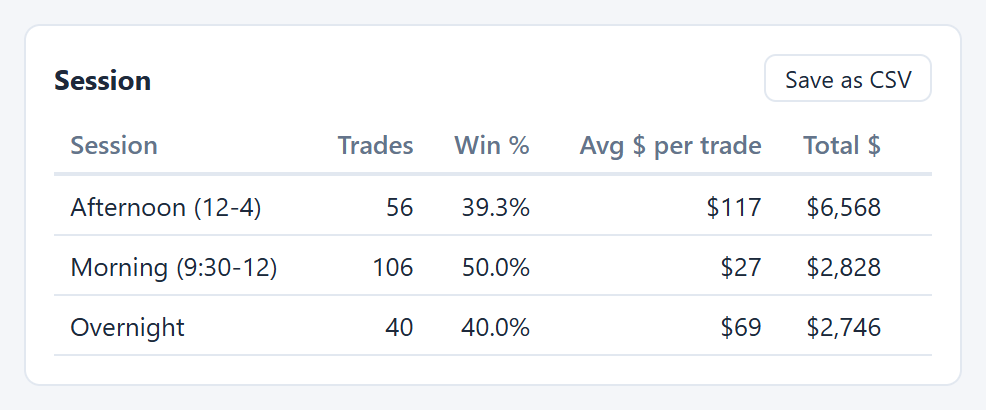
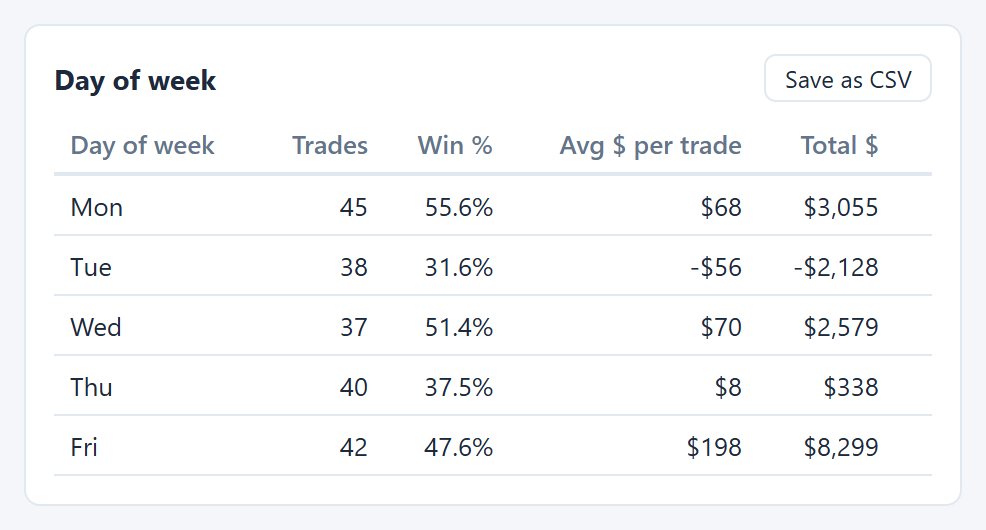
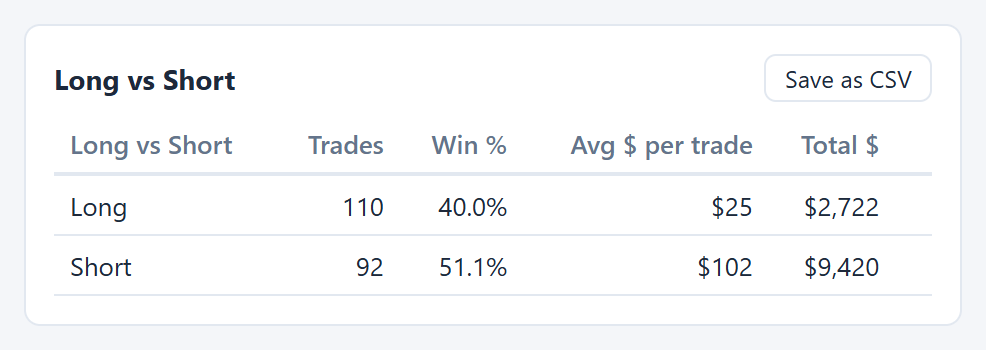
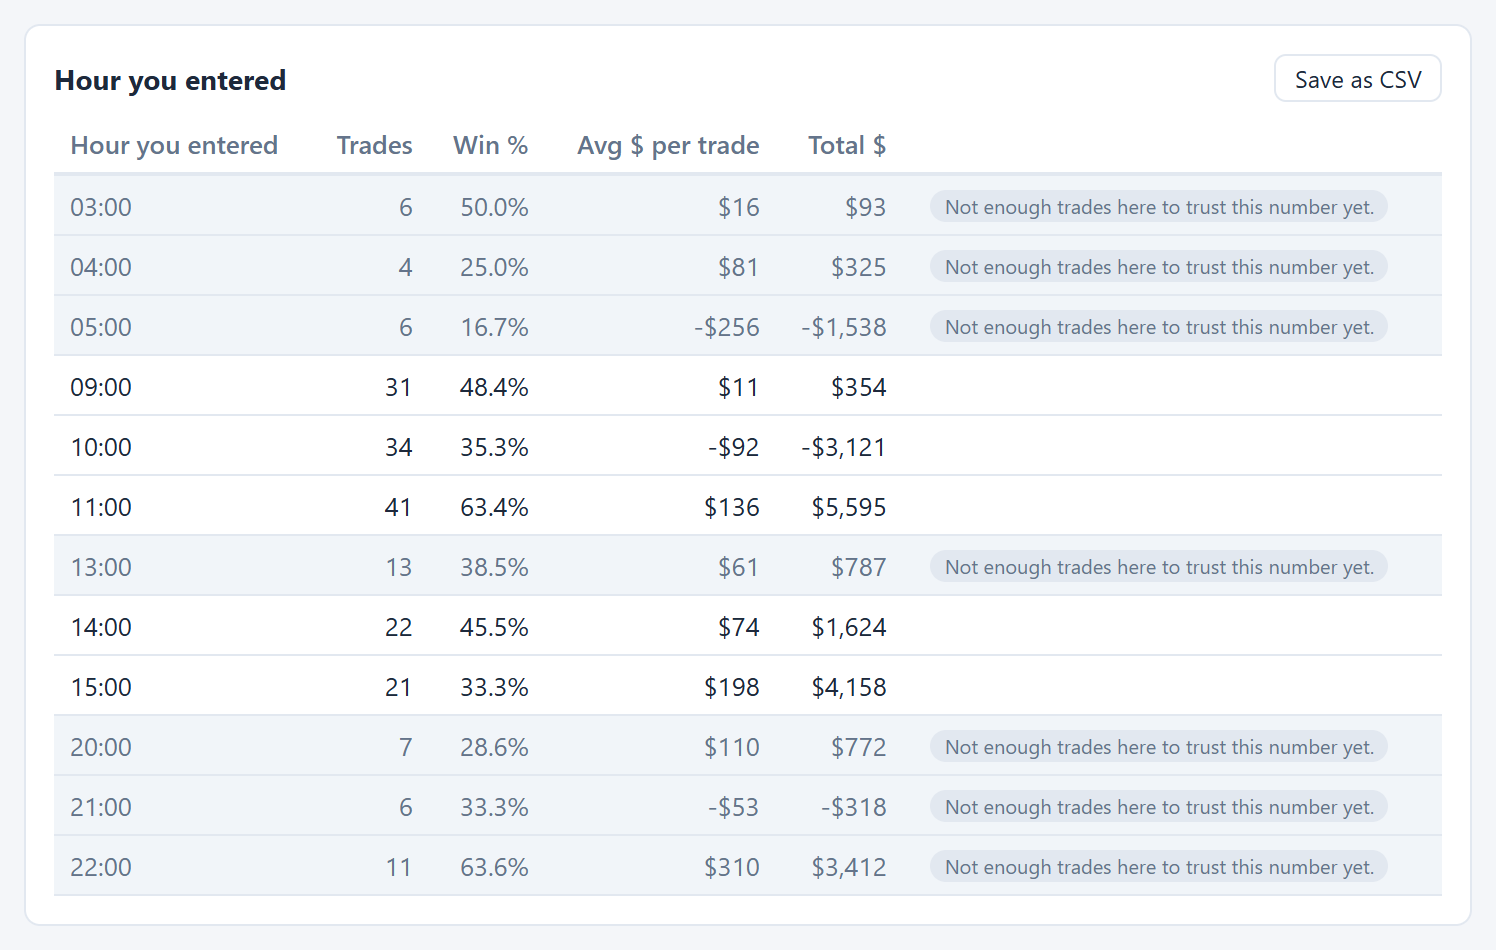
Your results split by symbol, setup, session, day of the week, long or short — or any tag you already keep in your own spreadsheet. Every column in your log becomes a table, and the best and worst are obvious at a glance.
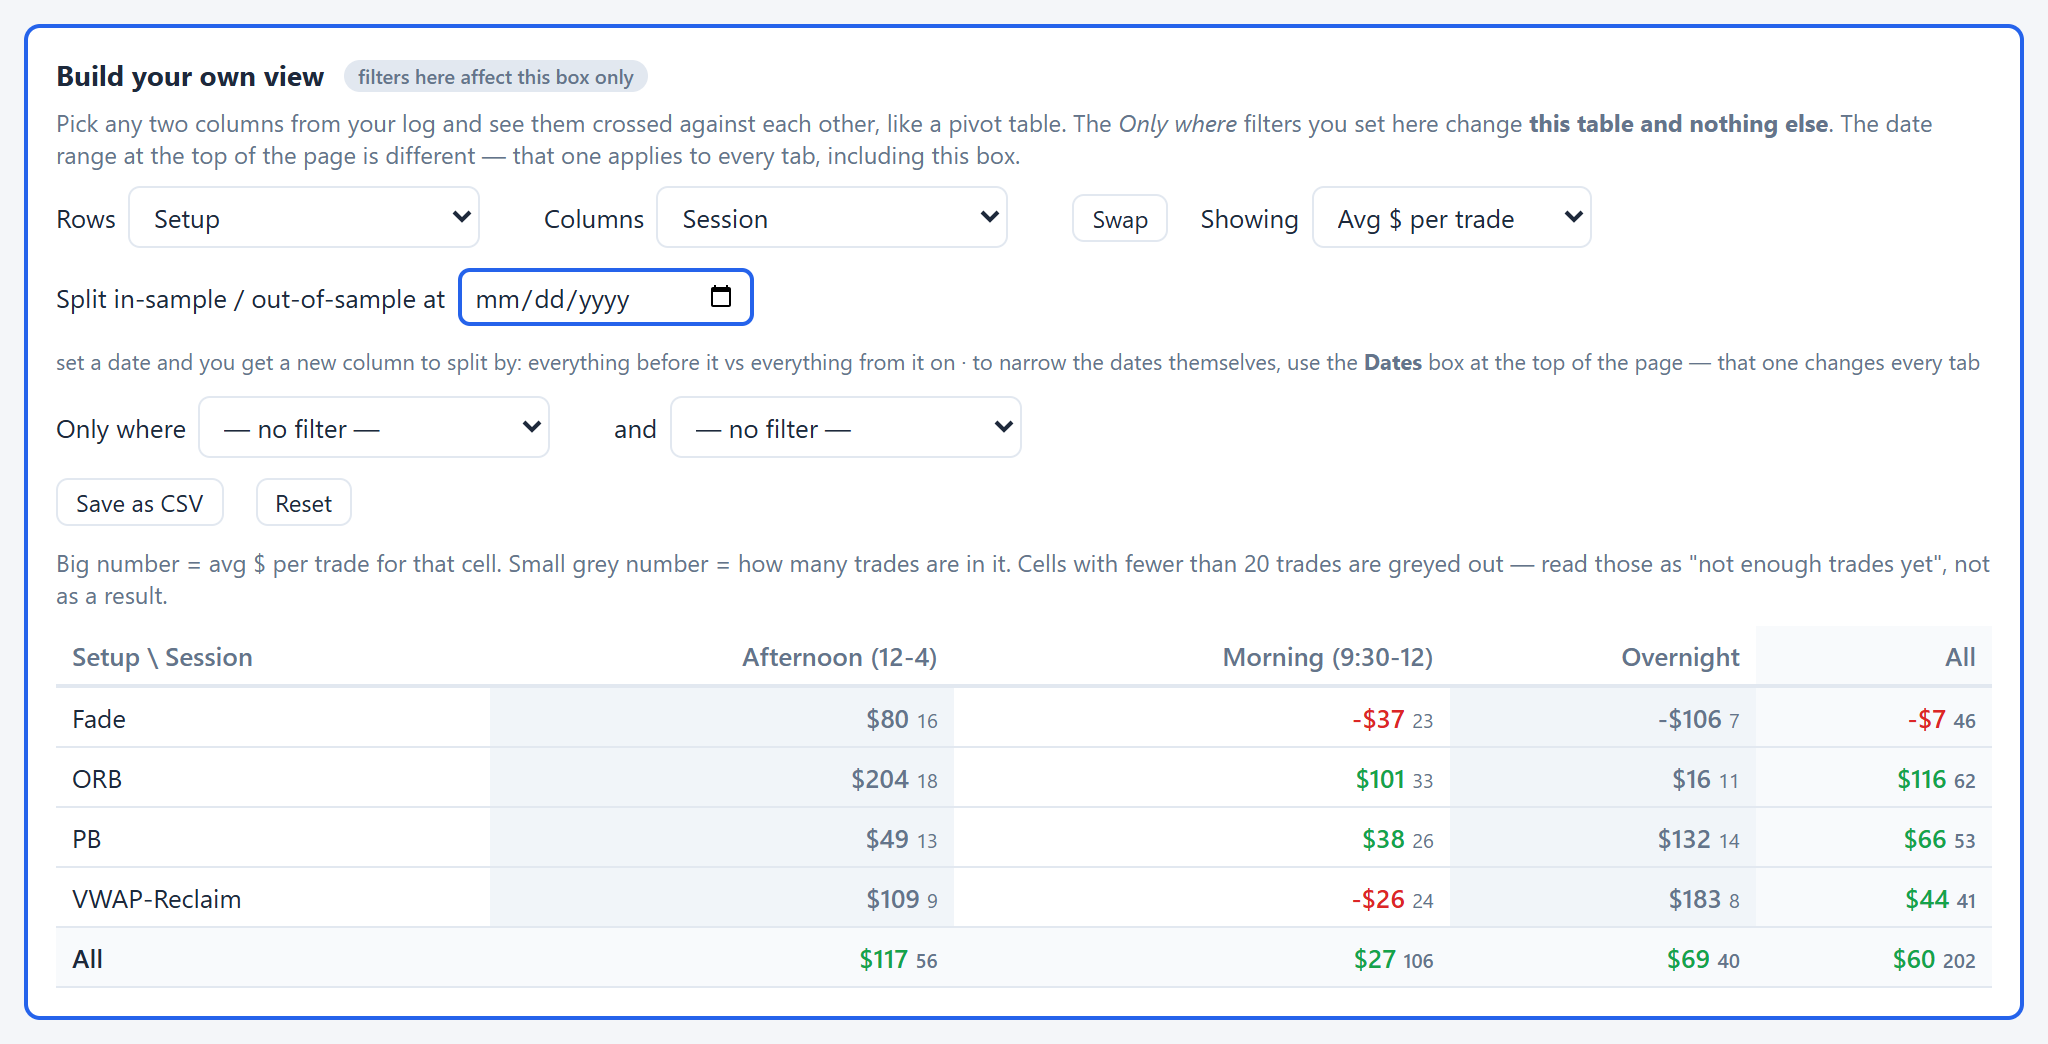
Then cross any two of them, like a pivot table: which setup works in which session, which market on which day. Each cell shows how many trades it holds, and a cell with too few trades is greyed out, so you don't read a lucky handful as a result.